Define the Bifacial Layout Objective and Usable Land
Whole-Site Energy and Specific Yield Answer Different Questions
Decide whether the project is trying to maximize annual energy from a fixed parcel, meet a required energy target at acceptable cost, or maximize the value of electricity under a particular tariff. These are different comparisons. If the objective is annual site energy, use delivered AC kilowatt-hours for the entire array. Do not rank layouts solely by kilowatt-hours per installed kilowatt.
Start with the Area the Array Can Actually Use
Draw the buildable area after removing required setbacks, access roads, drainage routes, utility corridors and equipment areas. On an operating industrial site, reserve the routes needed for maintenance vehicles and the existing business. A rectangular area calculated from module count is not a complete site layout.
Keep required structural, foundation and electrical conditions as entry requirements. A favorable energy estimate does not qualify a rack that cannot meet the project’s loads or a foundation that does not suit the ground.
Compare Row Pitch, Tilt and Ground Clearance Together
Use Unambiguous Layout Dimensions
Row pitch is the distance between corresponding points on adjacent rows, measured in the cross-row direction. It is different from the clear gap between the projected edges of two tables. Define clearance as the distance from the ground to a stated part of the table; in the schematic below, it is the lowest module edge. A proposal that gives only “height” leaves that reference unclear.

Increasing pitch changes row-to-row shading and the ground area visible to the module rear. Increasing clearance changes the rear-side view and the physical structure. Tilt changes the front-side solar geometry, row shadows and the table envelope. Model the combination rather than adjusting one dimension and assuming the other effects stay fixed.
GCR and Module Orientation Need the Actual Geometry
The System Advisor Model uses ground coverage ratio, or GCR, in both self-shading and rear-irradiance calculations. For regular rows, its definition uses the table’s sloped cross-row length divided by row pitch. Do not substitute the clear aisle width or silently use a horizontally projected cover ratio. State the software definition with the input.
Compare portrait and landscape module arrangements using the actual module dimensions, allowed clamp locations and rack members. Orientation changes the table geometry and possible rear obstructions. There is no orientation that wins for every module, structure and site.
Account for Ground Reflectance and Rear-Side Obstructions
Use the Ground Surface the Site Will Maintain
Bifacial modules receive light on both faces, but rear irradiance is not uniform. Sandia’s PV Performance Modeling Collaborative identifies array geometry, nearby racking and equipment, and surface reflectance as factors. A bright ground surface in a marketing image is not an energy-model input for a different site.

Use a defensible ground reflectance, or albedo, profile for the surface that will exist in operation. Soil, vegetation, paving, snow and planned surface treatments need different assumptions. Evaluate seasonal changes and a lower-reflectance case where they could affect the choice. Do not assume a new reflective surface stays clean or unchanged throughout the project.
Model the Structure Behind the Modules
Include rear-side rails, beams, cable management and nearby equipment at the level of detail appropriate to the model. Ask what the model represents and what it approximates. A simple uniform rear gain can miss uneven illumination and its electrical effect. NLR’s bifacial_radiance toolkit offers geometric modeling of those effects, but using the tool still requires credible inputs.
Keep structurally required members in the layout. If a rear obstruction is material to performance, evaluate an approved alternative detail with the designer. Removing a brace from an energy sketch does not make it an acceptable racking change.
Example: Higher Yield per Kilowatt, Lower Energy from the Site
Count Rows Within the Usable Depth
Consider a hypothetical level layout zone with 60 m of usable north–south depth after the required perimeter access and drainage reserves. Use a 2P arrangement: two portrait modules, each 2.2 m long, with a 25 mm gap give a table length of 4.425 m along the slope. Each east–west row has 50 columns of two 500 W modules, or 100 modules; assume the east–west arrangement and access already fit the plan. Both layouts meet the same structural, foundation, maintenance and electrical brief. Keep tilt at 20° and lowest-edge clearance at 0.8 m in both; use 6.0 m row pitch for A and 6.7 m for B.
The horizontal table depth is 4.425 × cos(20°) = 4.158 m. The row count is floor((60 − 4.158) ÷ pitch) + 1, where floor rounds down to a whole number. A fits 10 rows and B fits 9: 1,000 and 900 modules respectively. For the energy comparison, separately assume annual outputs of 700 MWh AC for A and 675 MWh AC for B. Those values include inverter and wiring losses and no curtailment; they are not calculated from row spacing alone. A project comparison needs the same weather, module model, albedo and loss methods, with each layout’s actual geometry and electrical design.
Choose the Layout That Meets the Stated Objective
A has 1,000 × 0.5 = 500 kW DC of nameplate capacity. B has 450 kW DC. Dividing annual AC energy by installed DC capacity gives a specific yield of 1,400 kWh/kW DC for A and 1,500 kWh/kW DC for B. B uses each installed kilowatt more productively, but A supplies 25 MWh more annual AC energy from the same parcel.
Choose A if the owner’s controlling objective is maximum annual energy from this parcel. Choosing B merely because its specific yield is higher would answer a different question. This does not identify the more profitable design: equipment and installation costs, maintenance, tariff and the timing of delivery still matter.
Revisit the result if an export limit clips A’s additional production, the energy has different value by time of day, or realistic albedo and shading assumptions reverse the annual totals. If both layouts meet a fixed energy target, compare the cost of meeting that target rather than assuming the larger array remains preferable.
Swipe to view the complete table.
| Measure | Layout A: more modules | Layout B: wider rows |
|---|---|---|
| Tilt | 20° | 20° |
| Lowest-edge clearance | 0.8 m | 0.8 m |
| Row pitch | 6.0 m | 6.7 m |
| Horizontal table depth | 4.158 m | 4.158 m |
| Rows within the 60 m usable depth | 10 | 9 |
| Module count | 1,000 | 900 |
| Front-side DC nameplate capacity | 500 kW | 450 kW |
| Assumed annual delivered AC energy | 700 MWh | 675 MWh |
| AC energy per installed DC capacity | 1,400 kWh/kW DC | 1,500 kWh/kW DC |
| Choice for maximum annual energy on this parcel | Preferred under stated assumptions | Higher specific yield, lower site total |
Specify the Bifacial Racking Layout You Actually Compared
Keep the Energy Model and Racking Drawing Consistent
Put the accepted module, table geometry, tilt, pitch and lowest-edge clearance on the layout drawing. Include relevant terrain differences, rack members and cable routes. The energy model and structural proposal must describe the same arrangement; an energy estimate for an open rear face cannot substantiate a materially different support layout.
Preserve Module Support and Maintenance Access
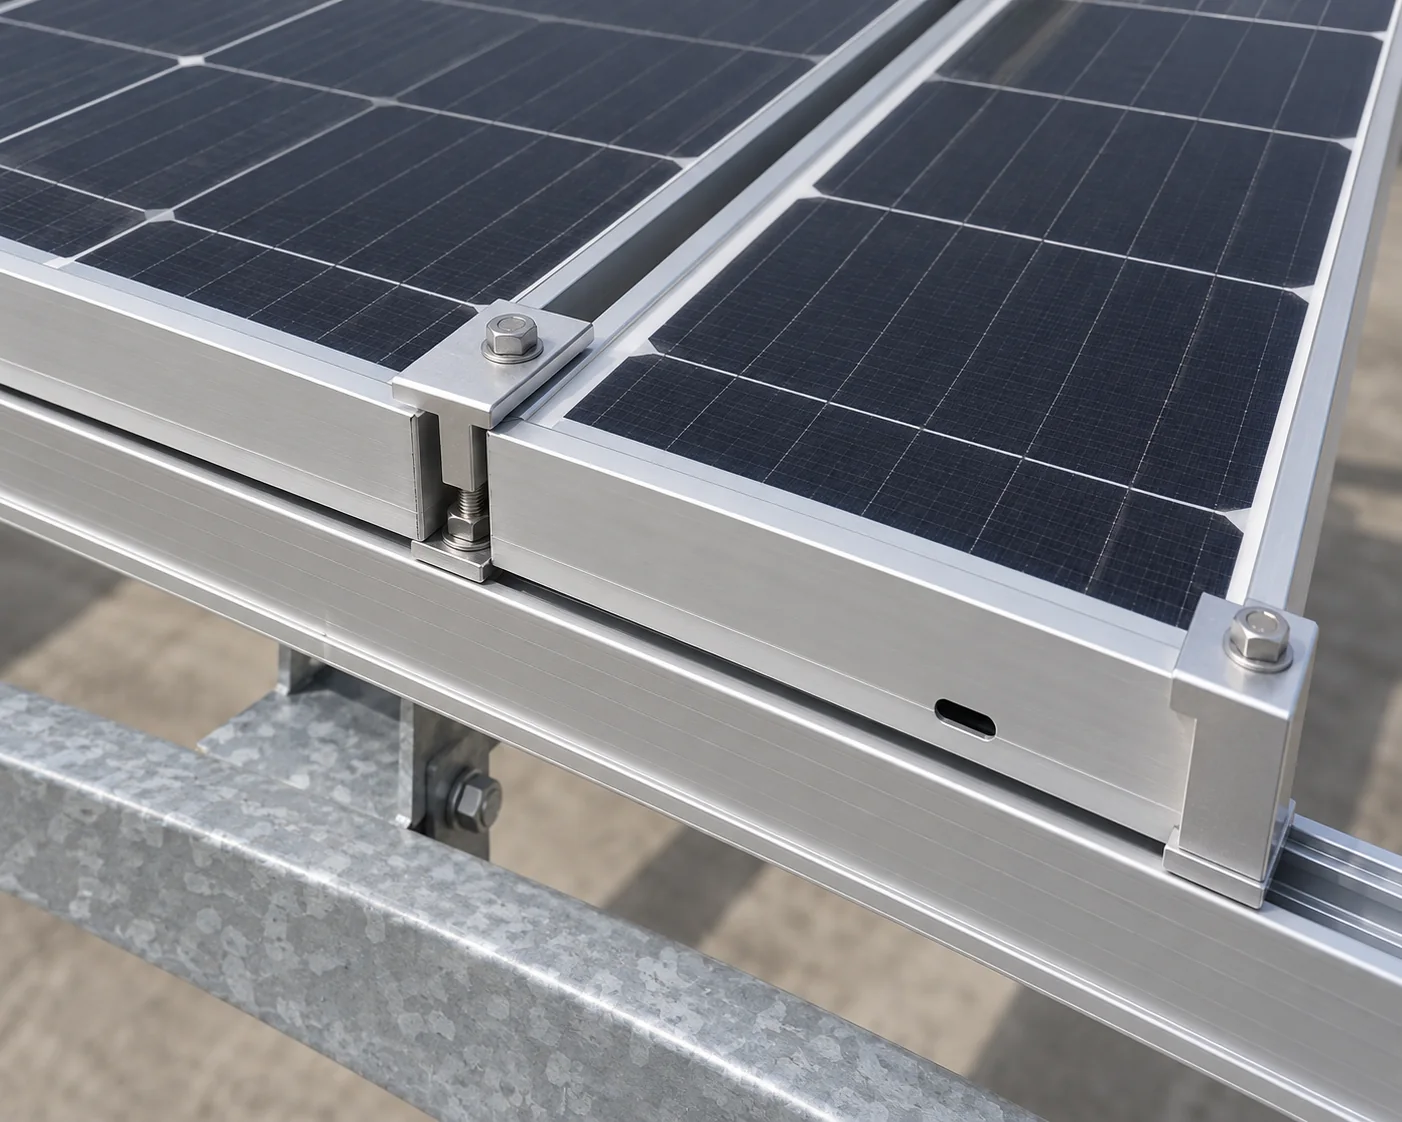
Carry the module’s permitted support and clamping locations into the racking specification. Confirm that installation and maintenance access remains workable after the foundations, electrical equipment and site drainage are included. More theoretical rear light has little practical value if vegetation cannot be controlled or components cannot be serviced.
Ask for a comparison summary that states total annual AC energy, installed DC capacity, usable land, the main model assumptions and the sensitivity that could change the choice. Keep the source model and accepted layout revision with it. That is more useful than a single unsupported bifacial-gain percentage.
Frequently asked questions
Does a bifacial module’s rear-side rating equal the project’s energy gain?
No. A module rating describes specified test conditions. Project energy depends on the light reaching both sides, temperature, shading and electrical behavior over time. Use the module data in an appropriate model rather than adding a fixed percentage to annual output.
Is the widest row spacing always best?
No. It may improve output per module while leaving room for fewer modules. Compare whole-site energy or project value after keeping access and structural requirements satisfied.
Should a white ground covering be included automatically?
Only as a defined alternative with realistic maintained reflectance, installation and maintenance costs, drainage and site suitability. Compare it with the actual untreated surface. Do not assume a permanent energy gain from its initial color.
Can a monofacial energy estimate be reused for a bifacial array?
It can provide a front-side reference, but it does not by itself model the rear contribution or uneven rear illumination. Use a suitable bifacial method and keep the reference layout and assumptions explicit when reporting a gain.
What if the industrial parcel slopes or has different ground surfaces?
Represent the relevant terrain and surface zones with a method that can handle them, or separate them into justified modeling areas. Check the software limitations; a regular flat-row approximation may not describe every part of the site.
When should a different module or rack trigger a new energy comparison?
Rerun the affected analysis when the change alters table size, pitch, clearance, rear obstructions, electrical behavior or the maintained ground surface. A nominally similar component is not proof that the original energy result remains valid.
Technical Basis and Source Scope
Sandia National Laboratories, Bifacial PV Performance Models, opening discussion of spatial rear irradiance, racking and albedo, checked October 19, 2026.
System Advisor Model online help, System Design, “Ground coverage ratio (GCR)” and “Land Area”; NLR, Photovoltaic Bifacial Irradiance and Performance Modeling Toolkit, “Model Methodology,” checked October 19, 2026. These sources support the variables and modeling approach, not the example’s assumed energy totals or a universal optimum layout.